


Robeco: Überraschender Höchstwert
In seinem aktuellen Blog-Beitrag widmet sich Jeroen Blokland den Abweichungen der "macro surprise indices" in den USA und der Eurozone.
17.04.2015 | 09:05 Uhr
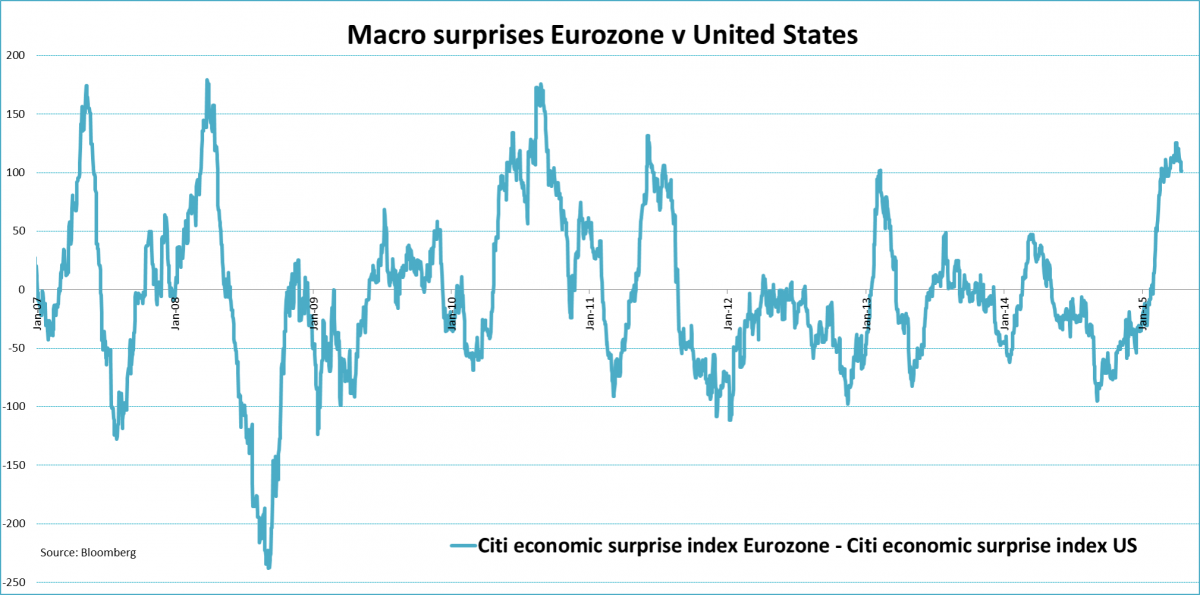
Lately, there has been a lot of attention for the major divergence in the macro surprise indices for the US and the Eurozone. The graph below shows this divergence for the Citi surprise indices. Macro data have been poor in the US, while economic numbers from the Eurozone have been strong. The question here is, does this massive divergence and the possible peak we have reached hold any information about future stock returns?
To answer this question I looked at peaks in the surprise index of the Eurozone area relative to the surprise index of the US in recent years. A peak is arbitrarily chosen here as a +100 ‘point’ difference between both surprise indices. In most cases the difference between the US and Eurozone surprise index lingers a while above the 100-point threshold before coming down. To keep things simple, a peak is set on the day with the biggest difference for each series of continuous days on which the difference was bigger than 100 points. Hence, I did not take into account the fact that the time period before and after the peak differs in each case.
Next, I looked at the returns of Eurozone stocks (Euro Stoxx 50 index), relative to US stocks (S&P 500 index) 30, 60 and 90 days after the peak was reached. The results are shown the table below. Since 2007 there have been seven occasions in which the Eurozone surprise index ‘peaked’ the US surprise index by more than 100 points. In each of the three periods considered thereafter European stocks underperformed US stocks. Interestingly, the underperformance increases as the interval after the peak gets longer. Do European stocks trail their US counterparts ‘just’ 1.2% after 30 days, for the 90-day window after the peak European stocks lag US stocks by more than 5%. Moreover, for the 90-day interval the return was negative in all occasions.
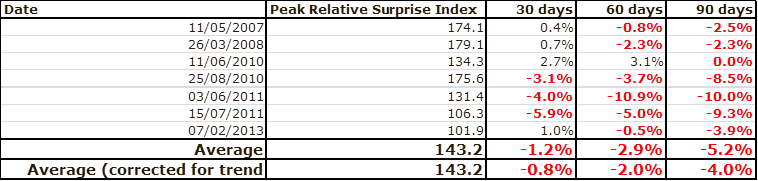
One thing should be mentioned here, though. Since 2007, European stocks have consistently underperformed US stocks. In order to separate this downward trend from the relative performance related to a peak in the difference between the Eurozone and US surprise index, I corrected the returns using the average daily return over the whole data sample starting in 2007. That doesn’t change all that much, however. The results still indicate that a peak in the relative surprise index is often followed by an underperformance of European stocks. Hence, if we just witnessed a new peak in the difference between the surprise indices for the Eurozone and the US (as the first graph seems to reveal), European stocks could lag in the coming months.
More on the Surprise Indices
Surprise indices reflect how economic data is progressing relative to the consensus forecasts. If consensus is too optimistic, realized macro data will come in below expectations causing the surprise index to fall. If the consensus forecast is too negative, macro numbers will surprise on the upside causing the surprise index to rise.
Diesen Beitrag teilen: