


Henderson: Brexit - six charts on what it means for fixed income
The newly-installed British Prime Minister Theresa May has stated ‘Brexit means Brexit’, however the nature and timing of the UK’s withdrawal from the European Union (EU) remains unclear.
23.11.2016 | 15:02 Uhr
At a domestic level, the new cabinet means that fiscal policy is also a source of uncertainty – although this week’s November Autumn Statement should give useful direction – and there has been unhelpful transgressions by politicians into (supposedly independent) monetary policy. Coupled with this, the rise in populism has gained momentum globally – highlighted most recently by Donald Trump’s election – with French, German and Dutch elections next year, all adding to investor uncertainty within financial markets.
Against this backdrop, fixed income investors have had to contend with a challenging combination of both currency and bond market volatility, as shown in charts 1 and 2.
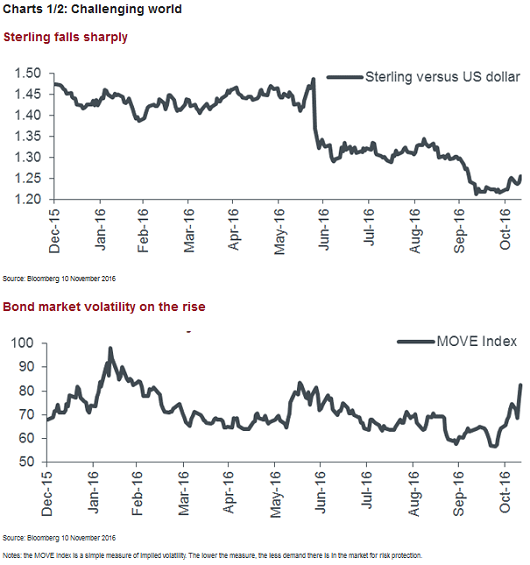
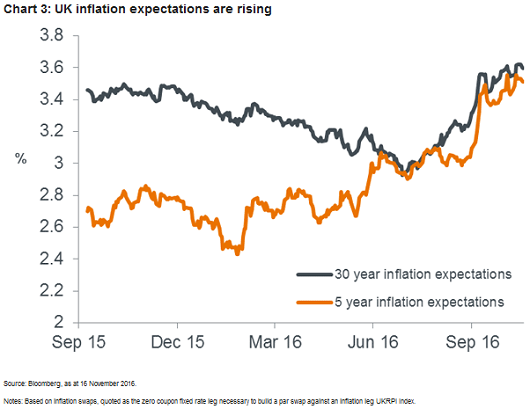
Policy uncertainty and sharp moves in foreign exchange markets have implications for inflation. While an increase in short term levels of inflation can be attributed mainly to sterling weakness, it is the longer-term outlook that should be most concerning for fixed income investors, with the eroding effect it would have on real returns (see chart 3). The recent spike in 30-year inflation expectations can be attributed to Brexit-induced expectations of fiscal expansion (expected to be announced in the Chancellor’s Autumn Statement), a shrinking pool of labour due to immigration restrictions, and the prospect of protectionism and tariffs.
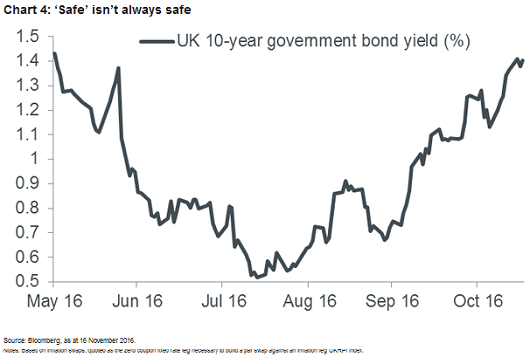
Where does this leave fixed income investors? Investment grade bond yields are still low by historical standards – thanks to financial repression, in the form of quantitative easing – however the Trumpian expectation of global reflation has left the market in an extreme state of flux. The previously accepted expectation of a ‘lower-for-longer’ world for bond yields is far from certain, which could lead to further outflows from the asset class, begetting further poor performance (rising yields and falling prices). Investors cannot therefore always rely on the perceived ‘safety’ of the investment grade space.
For example, chart 4 below shows the yield on UK 10-year government bonds (yields move inversely with price). By way of example, an investment made at the July low would have resulted in a 4.9% loss (as at 16 November 2016). Some investors may see current levels as an attractive entry point, however it may take an even more substantial correction in prices until yields are at a level that offer good risk-adjusted returns and buyers return.
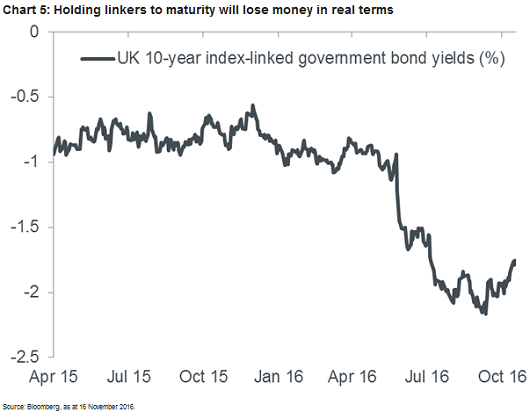
Inflation-linked bonds appear to offer little protection either. Chart 5 shows that UK 10-year inflation-linked government bonds yields are negative, implying that – should inflation stay at current levels – investors will lose money in real terms on their investment if held until maturity.
Where to go?
With yields so low in ‘safe’ fixed income asset classes, investors may want to consider higher-yielding alternatives, such as secured loans and high yield credit. Not only do we consider the risk/return profile to be more attractive here, high yield has typically been a better place to be within fixed income when yields rise. This is reflected in the lower aggregate duration of these assets, as shown in chart 6.
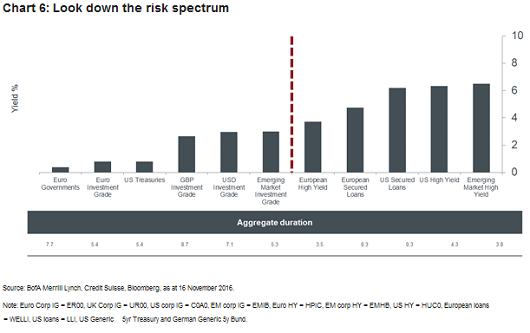
While high yield bonds come with a higher credit risk, we believe the attractive combination of yield and lower duration makes the trade-off worthwhile. We continue to see relative value, although selectivity is warranted, given the range of creditworthiness of issuers. Volatility and political uncertainty mean that a long-term and patient approach is required from investors.
Diesen Beitrag teilen: