


ETF Securities: In focus - emerging market equities
Global equities have been rallying in 2017, led by Asian emerging countries and North America to a lesser extent. The IMF expects Asian economies to continue to drive global growth while central banks in advanced economies are gradually reducing their financial support.
14.12.2017 | 08:38 Uhr
Global equities have been rallying since the end of 2016 asstrong economic data from major advanced and developingcountries combined with a decline in perceived politicaluncertainty has led to a surge of optimism on the globalfinancial market. Extremely accommodative monetary policiesin place since the great financial crisis are bearing fruit. 2018will likely see these accommodative policies graduallydismantled, opening the path to new investment opportunities.
2017 performance
This year has seen global equities rallying since November2016 as market participants are more confident that globaleconomic growth has returned and will continue. While fewrisks remain, with the Italian election next year and theongoing fight against terrorism and North Korea, the populistthreat seen in 2016 has faded away. Unemployment is near itslowest in the US and UK with central banks now focussing ondismantling quantitative easing and tackling the inflation issue.
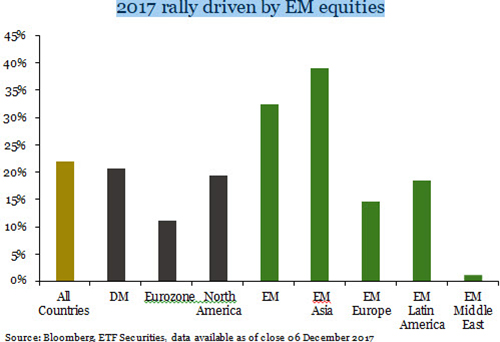
Looking at 2017 performance so far, the MSCI AC World indexrose by 22%, driven by the rally of emerging markets (EM) andmore specifically, emerging countries from Asia (39%). Thedeveloped markets (DM) with North America come second at19.5%, followed by emerging Latin America at 18.5%. Whileone would expect volatility to pick up, 2017 saw the marketvolatility index (VIX) at its lowest level ever, at 9.6 on average,compared to 20 its historical average, suggesting that investorscould increase their allocation to equities almost risk free.

Of the top 20 performers, 75% are emerging market countries.Argentina is leading the board with 62.6% year-to-date whileChina comes fourth (52%) and India eleventh (25.7%).
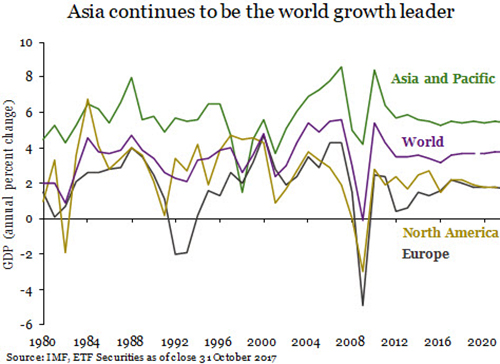
In its October World Economic Outlook, the InternationalMonetary Fund (IMF) estimated global growth at 3.6% in 2017and 3.7% in 2018 from 3.2% in 2016 driven by rising industrialactivities and business and consumer confidence. Globalgrowth will be mainly driven by EM countries projected at4.6% in 2017 and 4.9% in 2018. China GDP has been revisedupward by 0.2% compared to April, at 6.8% in 2017 and 6.5%in 2018 while India GDP for 2017 was revised down from 7.2%to 6.7%. In Latin America, Argentina is expected to reboundafter last year’s recession with growth projected at 2.5% for2017 and 2018 as consumption and investment recover.
What are the ratios saying?
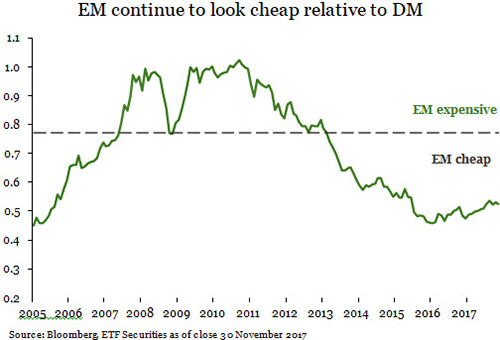
The cyclically adjusted price to earnings ratio (CAPE) of DMover EM shows that developing countries remain attractivefrom a valuation point of view. Whilst the MSCI EmergingMarket index has returned 30% year-to-date, the below chartsuggests there is still scope for further gains in 2018.
In the following chart, the Latin American countries Argentina,Brazil, Colombia, Mexico and Chile, appear to be the mostundervalued. Despite prices for these countries rising by 23%on average, the CAPE ratio remains below their respectivehistorical averages driven by lower-than-average real earnings.However, all except Chile saw their real earnings growing thisyear in absolute terms, suggesting further potential catch-up oftheir earnings in the near term.
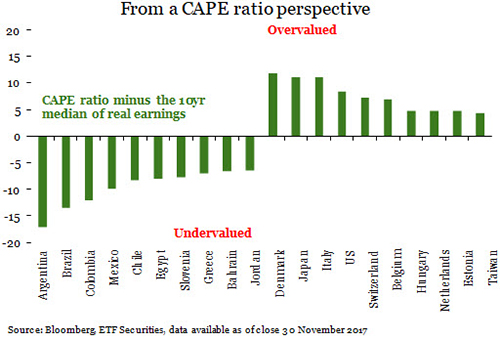
At the other end of the spectrum, US, Japan and few Europeancountries are considered as overvalued. The CAPE ratio foreach stands above their historical level due to real earningshaving already catched up with its respective historical leveland price rally. Further gains would be more difficult to justify.
A closer look at China
Xi Jinping came out of the 19th Congress of the ChineseCommunist Party stronger than ever. Elevated to the samelevel as Mao Zedong, the president of the Republic of China hasbeen given more power than any of his contemporarypredecessors and with no one in its close committee potentiallyqualified to replace him in five years. With Xi having a historyof stalling reform, we may see the implementation of shortterm stimulus, as opposed to long term structural reforms,continue. This should be positive for Chinese equities as thecountry focuses on sustainable growth, attracting foreigninvestment and remaining the largest consumers ofcommodities to meet the need of its economy and population.The outcome has initially been positively received as the MSCIChina Index gained 8% one month following the Congressbefore declining recently as Chinese economic activitiescontinue to show signs of a mild slowdown.
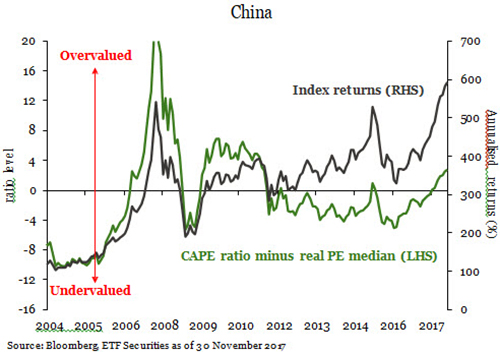
The above chart shows that China CAPE ratio currently standsabove its historical level, suggesting that Chinese equities areovervalued. However, the surge of the MSCI China Index pricelevel has been the main driver of the increase in the CAPEratio. The index real earnings per share have been below itshistorical average over the past two years but are graduallyrecovering toward its mean since the beginning of the year. This picture combined with the potential decade lengthinvestiture of the “Strongman” suggests further potentialupside for Chinese equities in the medium term.
Non-resident capital inflows in EM, mainly China, reached abottom in 2015, according to the IMF, on concerns over theimpact the US taper tantrum could have on EM asset pricesand the potential depreciation of the Yuan. Inflows haverevived since but is still half of the volume seen at its peak inQ1 2013. The recovery of investor sentiment regarding theglobal economy should see capital inflows in EM assetsincrease further in 2018.
Diesen Beitrag teilen: