


UBS: Are Soft Data Predicting a U.S. Boom?
Since the U.S. Presidential election last November, survey measures (i.e., soft data) for both consumers and businesses have been recording impressive gains. The performances of these surveys have led many to wonder if these movements insentiment will eventually translate into actual activity. In other words, are soft data telling us a boom in economic growth is on the way?
31.03.2017 | 08:27 Uhr
Survey measures are high but not historic
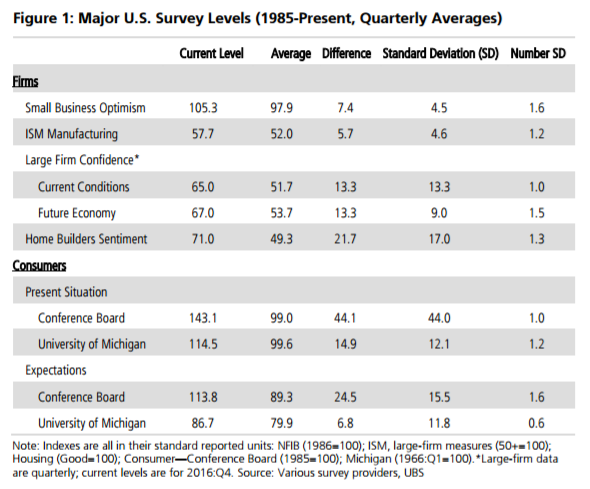
Survey readings across the board are indeed relatively high by historical standards (all are well above their long-term averages) but we are by no means in unprecedented territory. Business surveys are currently on average 1.3 standard deviations above their long-term averages and consumer surveys are 1.1 standard deviations—elevated but not extreme.
Yet the recent movements in surveys are quite noteworthy
While the levels of surveys are not unprecedented, the movements we have seen overthe last several months have been particularly rapid. These rapid changes are one reason we believe the soft indicators have received so much attention. To further add to this view, these rapid moves are following long periods of relatively low sentiment. Six of the nine measures we analyze were well below their long-run averages prior to the election. Most of these survey measures are now at post-crisis peaks.Business confidence—buoyed by high policy hopes—is the most noteworthy.
The most elevated of all survey measures is the NFIB's Small Business Optimism Index.Generally, the somewhat stronger performance of business surveys relative to consumer indicators likely in part reflects heavy expectations for pro-business government policies down the road. On this note, the NFIB survey was taken prior to failure of the repeal and replace of Obamacare. It is unclear how this will impact the NFIB and other surveys (including consumer ones).
Financial well-being likely plays a strong role in driving sentiment measures
Our simple statistical work shows that the underlying pattern of consumer survey measures resembles consumer spending. Similarly, we find that the underlying pattern observed for large firms looks similar to corporate profits.
Soft indicators in isolation point to strong growth in 2017:Q1 of 3.7 percent
Our simple survey-based model shows very strong GDP growth for this quarter at ayear-over-year rate of roughly 3.7 percent. Our own Q1 tracking estimate of 1.25percent quarterly growth at an annual rate would be consistent with 2.1 percent growth YoY. Taking this estimate, the positive gap between expected growth from the surveys and where growth is tracking is the largest it has been in a decade and close tothe highest it has been in 30 years. This is also true if we compare the implied growth from survey measures and the potential growth rate of the U.S. economy.
In fact, extended overprediction of soft data does not happen too often
Our model has actually diverged from actual growth since the middle of 2015. Softdata running far ahead of growth for this long is historically quite rare. The only other major time this occurred was in the mid-2000s and in this case, the survey measures corrected downward toward growth as we headed into the Great Recession. Given the few times soft data have behaved this way in the past, it is hard to say what to expect going forward. The hard data over the last few months cast doubts on a boom being the likely road ahead.
"Soft data" have been in the spotlight since the U.S. presidential election last November. Soft data, or survey measures, provide insight into the mood of economic agents but differ from hard data in that they are generally not tied to some actual measure of activity such as industrial production or retail sales. These indicators have been in the limelight recently because, simply put, they are performing better than they have in a long time, are signalling a stronger economy than most hard indicators are signalling, and the prevailing narrative is that, whilethere may be a lag, surging sentiment will have to eventually show up in actualactivity. In other words, soft data have sparked hopes of a boom in U.S. growth.
Our goal here is twofold. One, we analyze the current state of major U.S. soft data measures relative to the last several decades to see just how elevated sentiment is today. Two, using a simple statistical technique to pull out the most important underlying information from these indicators, we take a look at what soft data are telling us about growth today and how this compares to the historical relationship between growth and soft data.
Taking stock of surveys
There are a plethora of soft data measures for tracking the U.S. economy. Many ofthem are relatively new and only cover a short period of time. For this analysis, we focused on major surveys that have a long time series and are closely watched by forecasters and analysts. We also chose surveys to cover a diverse set of economic actors. Our analysis captures the views of small firms, large firms, manufacturers more specifically, consumers, and the health of the housing market.
Figure 1 below looks at quarterly levels of all of these indexes stretching back roughly three decades. The figure shows the current level (taken here as the most recent monthly reading), the average level and standard deviation since 1985, the difference today between the current level and the historical average, and how many standard deviations this difference represents.
Den vollständigen Artikel finden Sie hier als PDF.
Diesen Beitrag teilen: