Morgan Stanley IM: The Most Contrarian Outcome - No Landing

Morgan Stanley IM: The Most Contrarian Outcome - No Landing
Multi Asset Fonds

Given a strong consensus for a Soft Landing and lingering Recession fears, No Landing would be the most contrarian scenario for markets.

23.10.2024 | 05:45 Uhr

In fact, there are some hints that the dichotomy between strong spending and weak labor markets could resolve in favor of No Landing. Rates and some segments of the equity markets have overpriced a Soft Landing and would be vulnerable in this scenario.

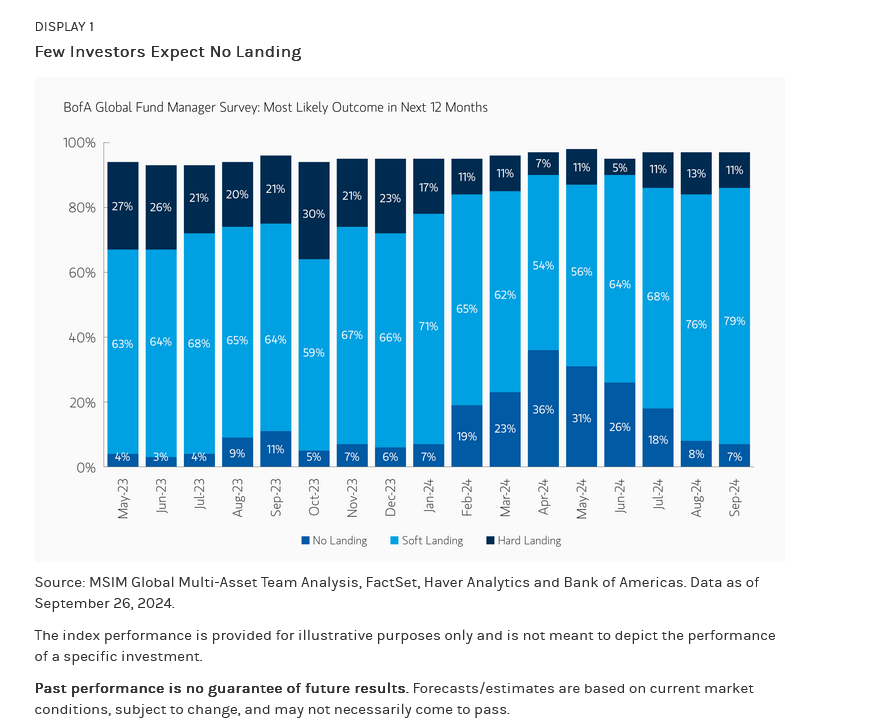
Recession risks have been top of mind since early 20221 when headline inflation reached 9%, the Fed hiked 525 basis points (bps) in 18 months (the steepest pace in 40 years) and the yield curve inverted by more than 100 bps. Such steep inversion has been a precursor to recession in the following year every time in the past six decades. But the U.S. economy exceeded the consensus and our expectations in late 2022, 2023 and the first half of 2024, averaging 2.3% annual growth. Despite this, today the overwhelming majority of investors (79%) still expect a Soft Landing (i.e. sub-trend growth) in the next year, and 11% expect Recession (Display 1).2 In fact, the most contrarian outcome for markets would be No Landing (i.e. above trend growth).

Abb-1
Abb-1


Recently, cautiousness on the economy has been driven by weakening labor market data, but households are consuming and businesses are investing.3 The consensus will likely face another positive surprise in Q3 with GDP likely to hit 3% vs 2% currently expected.4 And there are some indications that the dichotomy between a weak labor market and strong spending could resolve in favor of the latter:


1 According to the Wall Street Journal survey of economists, the estimated probability of recession over the next 12-months remained near or above 50% from July 2022 to October 2023.
2 Bank of America Global Fund Manager Survey – September 17, 2024. 40% of investors surveyed see a US recession as the biggest tail risk, more than twice as many who see an inflation reacceleration as the key tail risk.
3 Based on the latest retail sales, consumption may grow 3.5% in 3Q, and spending by businesses on equipment and intellectual property is expected to grow 8-9%.
4 The Atlanta Fed’s GDPNow forecasts 3.1% for Q3 and the New York Fed’s NowCast 3.0%


IMPORTANT DISCLOSURES

The views and opinions and/or analysis expressed are those of the author or the investment team as of the date of preparation of this material and are subject to change at any time without notice due to market or economic conditions and may not necessarily come to pass. Furthermore, the views will not be updated or otherwise revised to reflect information that subsequently becomes available or circumstances existing, or changes occurring, after the date of publication. The views expressed do not reflect the opinions of all investment personnel at Morgan Stanley Investment Management (MSIM) and its subsidiaries and affiliates (collectively “the Firm”), and may not be reflected in all the strategies and products that the Firm offers.

Forecasts and/or estimates provided herein are subject to change and may not actually come to pass. Information regarding expected market returns and market outlooks is based on the research, analysis and opinions of the authors or the investment team. These conclusions are speculative in nature, may not come to pass and are not intended to predict the future performance of any specific strategy or product the Firm offers. Future results may differ significantly depending on factors such as changes in securities or financial markets or general economic conditions.

This material has been prepared on the basis of publicly available information, internally developed data and other third-party sources believed to be reliable. However, no assurances are provided regarding the reliability of such information and the Firm has not sought to independently verify information taken from public and third-party sources.

This material is a general communication, which is not impartial and all information provided has been prepared solely for informational and educational purposes and does not constitute an offer or a recommendation to buy or sell any particular security or to adopt any specific investment strategy. The information herein has not been based on a consideration of any individual investor circumstances and is not investment advice, nor should it be construed in any way as tax, accounting, legal or regulatory advice. To that end, investors should seek independent legal and financial advice, including advice as to tax consequences, before making any investment decision.

The indexes are unmanaged and do not include any expenses, fees or sales charges. It is not possible to invest directly in an index. Any index referred to herein is the intellectual property (including registered trademarks) of the applicable licensor. Any product based on an index is in no way sponsored, endorsed, sold or promoted by the applicable licensor and it shall not have any liability with respect thereto. The S&P 500® Index measures performance of the large cap segment of the U.S. equities market, covering approximately 75% of the U.S. market, including 500 leading companies in the U.S. economy.

Diesen Beitrag teilen: